In the “Evaluation assessments” > Assessments Bank (AMI)” menu, the “Statistics” tab allows you to analyse the data in detail once the test has been completed.
The window shows the global statistics as well as those for the various test folders.
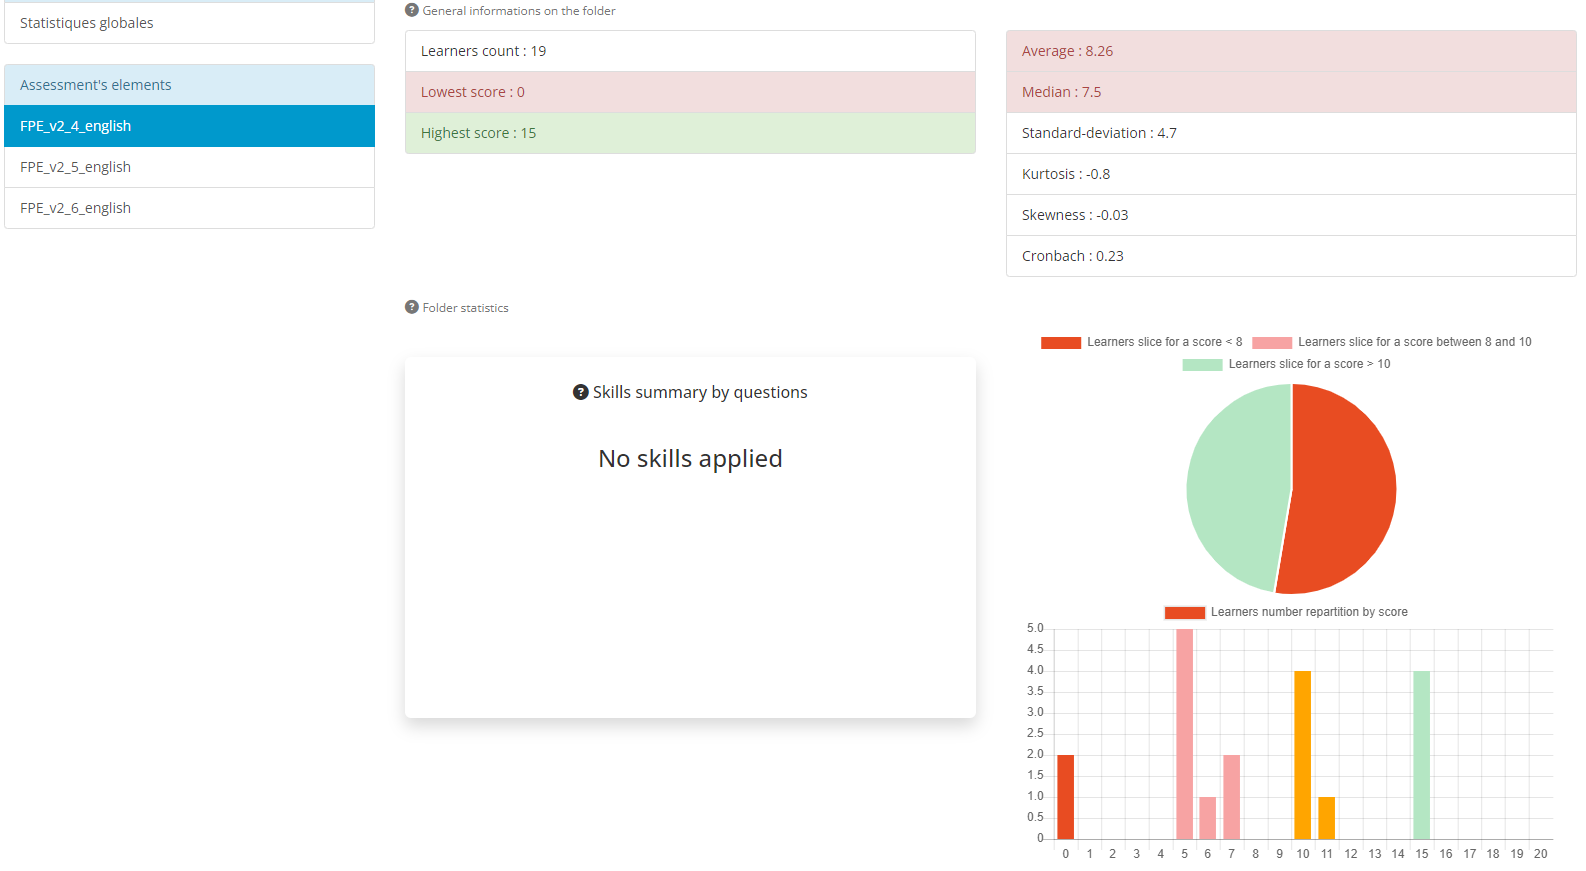
Statistical data for the examination, including all folders, is displayed.
This information is provided at the end of the test.

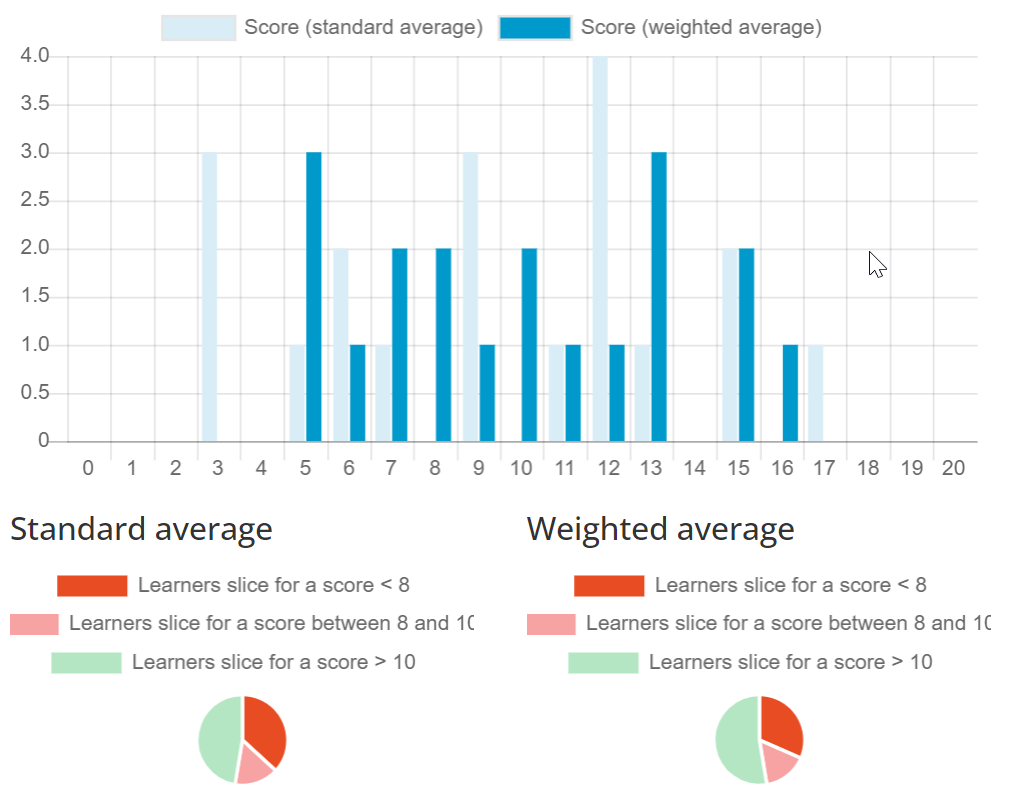
Various graphs complete this page:

The global statistics also include diagrams showing the average marks for each skill involved in the test (by folder and by question). Details of the skills involved and the average for each can be accessed by clicking on “Legend”.

When you select a folder, you will see the same elements as before, presenting the data for the folder in question.
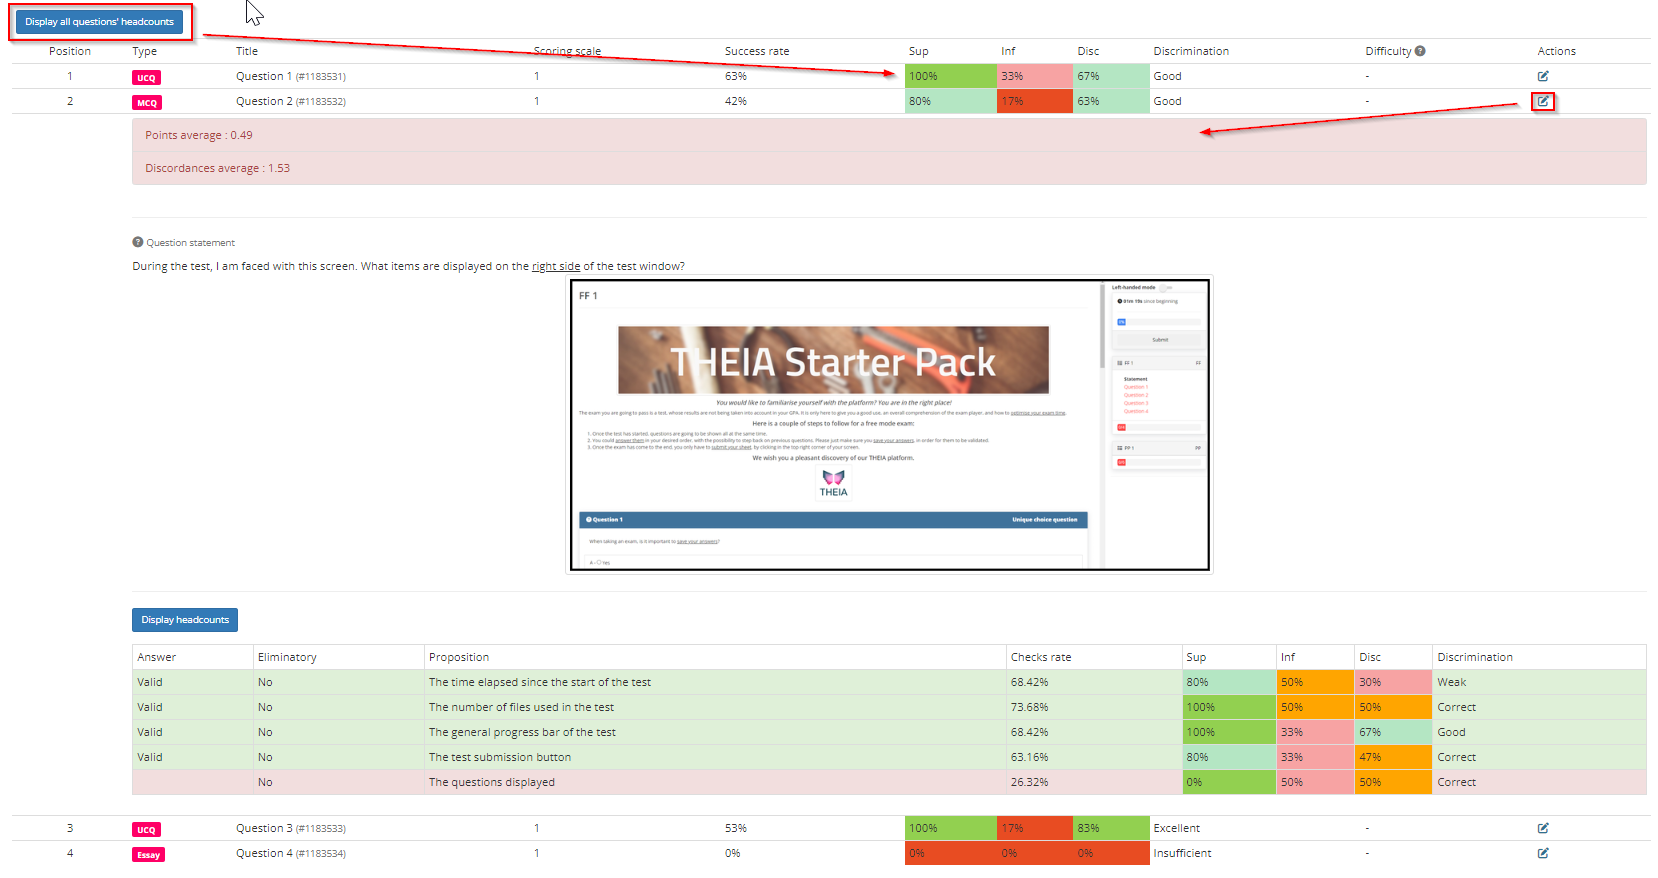
At the bottom of the page is a table analysing each of the questions in the folder. There are several elements:
The “Display numbers” button displays the number of users who correctly answered the question in relation to the group. In the example of MCQ #1, 15 of the 19 participants in the group with the best overall results in the test answered the question correctly (i.e. 80%). By the same token, 4 out of the 19 participants in the group with the lowest overall results answered the question correctly (i.e. 20%).
By clicking on the “Action” icon, it is possible to visualise more precisely the behaviour of users with regard to the proposals.

