The “Poll Sessions” module allows you to mobilise survey questionnaires and plan sessions for polling all or some of the platform’s users.
1. Creating and configuring a poll
1.1 Creating a new poll
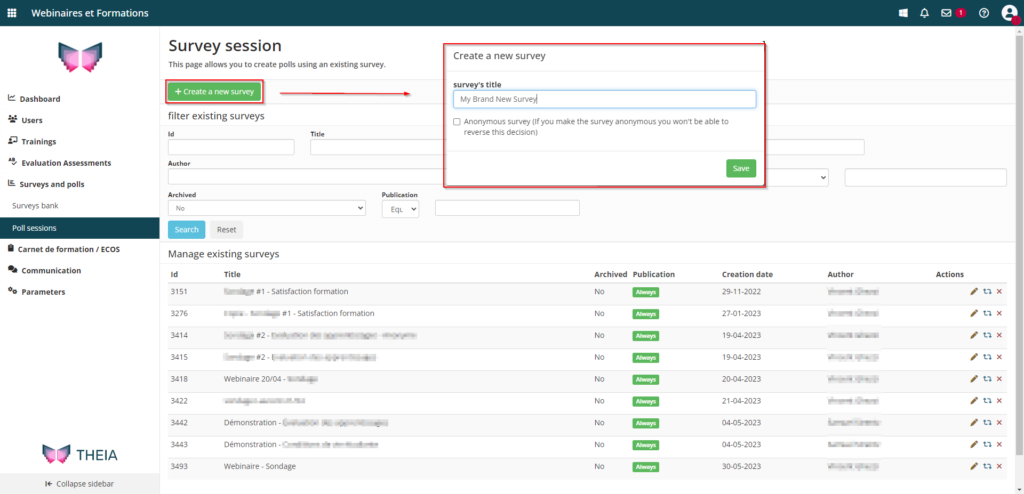
To create a poll on THEIA, go to the “Surveys and polls” tab on the platform and then to the “Poll sessions” tab. A survey session can be created using the “Create a new survey” button. An option allows you to activate the anonymisation of the survey (the names of respondents will not be displayed on the platform and there will be no possibility of sending invitation reminders to targeted users).
1.2 Configuring a poll session
A dedicated tab allows you to configure the survey session. For example, a field can be used to add an introductory message to the survey, made visible when the respondent accesses the survey questionnaire. Anonymisation and publication parameters are also available in this interface.
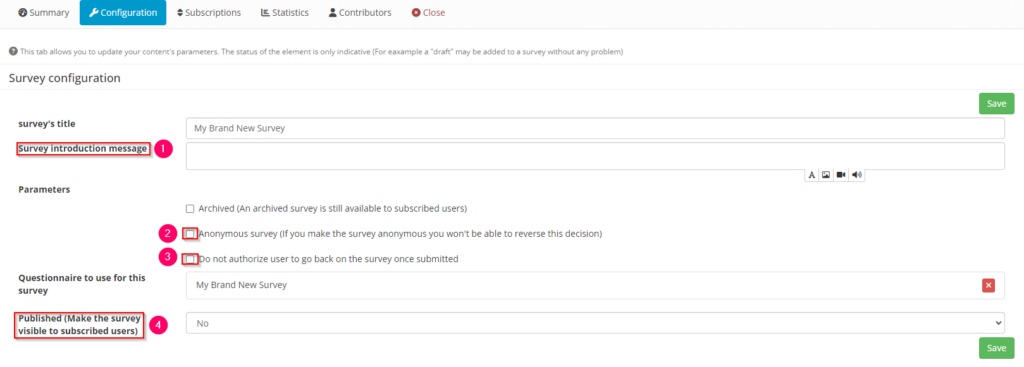
- 1: Fields for adding a survey introduction message
- 2: Survey anonymisation option
- 3: Option to prevent the user from returning to the survey once it has been submitted.
- 4: Publication parameters (unpublished, published, or published according to publication dates)
1.3. Selecting a survey
The poll session is based on the use of a survey questionnaire. To use this questionnaire in a session, first click on the “Select a survey from the bank” button. The list of survey questionnaires in the database will appear in a dedicated window.
Once you have identified the survey, simply click on the “Use this questionnaire” button to associate it with the survey session.

- 1: The “Select a survey from the bank” button is used to access the list of survey questionnaires available in the bank.
- 2: The “Use this questionnaire” button is used to associate the questionnaire with the poll session.
2. Mobilising participants
The poll session is used to distribute a survey questionnaire to a group of users on a platform. To enable the survey to be distributed, a “Subscription” tab allows the survey session organiser to invite participants to answer the questionnaires.
2.1 Subscribing participants
All users of a platform can therefore be asked to take part in a poll, and various filters (group category, group, surname, first name) can be used to facilitate the search for users to subscribe.
Once the search has been completed, a button can be used to subscribe or unsubscribe participants to the poll session. Once registered, the participant can answer the questionnaire in a dedicated space depending on the publication status of the session (see 1.2 Configuring a poll session).
On this same interface, it is also possible to unsubscribe respondents to the session, either via a dedicated unsubscribe tick, or via a button deleting the subscription and any responses entered by the participant. Please note that this deletion means that the data is permanently deleted.
Also, the information is not made visible if the poll is made anonymous! This is because submission statuses could compromise the anonymity guaranteed by activating the parameter.
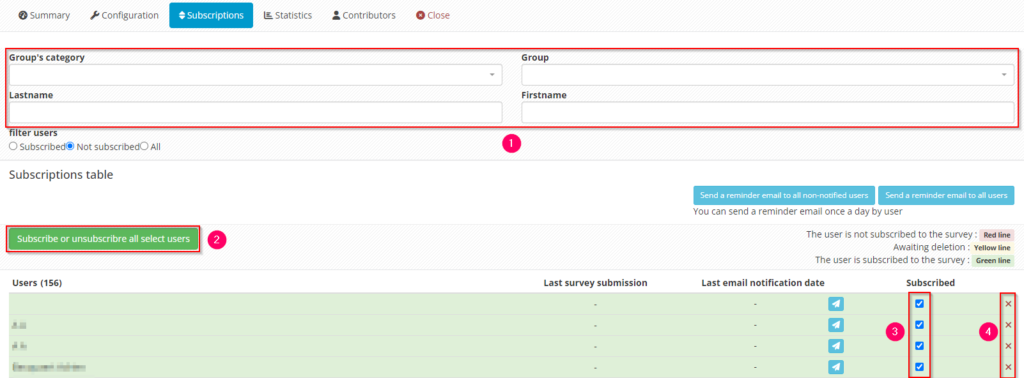
- 1: Filter area for searching for subscribed or unsubscribed users, etc.
- 2: Button for subscribing or unsubscribing selected participants
- 3: Tick to unsubscribe the participant from the session: the participant will no longer be able to access the poll, but their existing data will be retained.
- 4: Delete button: the participant is unsubscribed from the session AND the data is deleted.
2.2 Informing participants
The subscription tab can also be used to send email reminders to participants inviting them to complete the poll. The invitation email is sent to the email address associated with the user’s account.
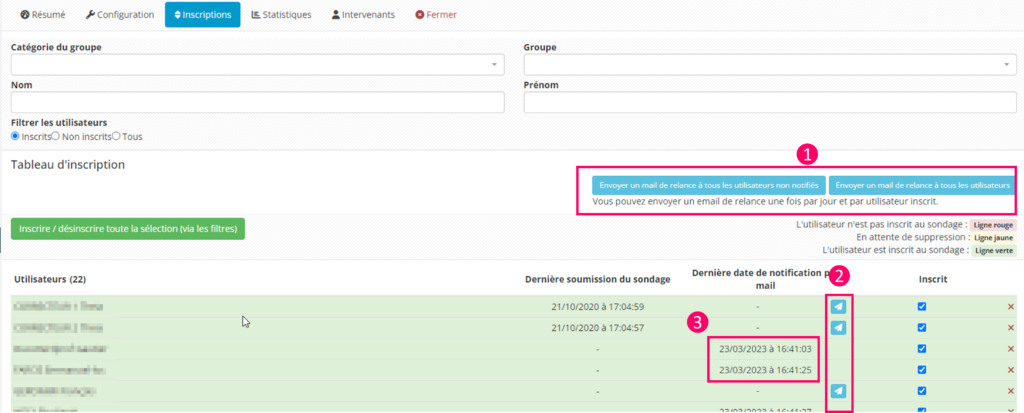
- 1: Button for sending reminder emails and collective notifications.
- 2: Column for sending individual invitations to take part in the poll.
- 3: Column showing date of last notification.
3. View the results of a poll
The statistics tab allows you to track participation, view and apply analytical processes (cross-referencing, filters) to the poll results and export the key data.
3.1 Viewing results
In the statistics tab, the first tab, “Participation“, shows the progress of the poll results. The poll manager(s) can view the participation data (progress, access date, submission status) of the various subscribers to the session.
Responses to questionnaires can also be viewed from this page using the various export options or the individual display of a questionnaire. Finally, this page provides access to detailed information and statistics via the questionnaire tab(s).
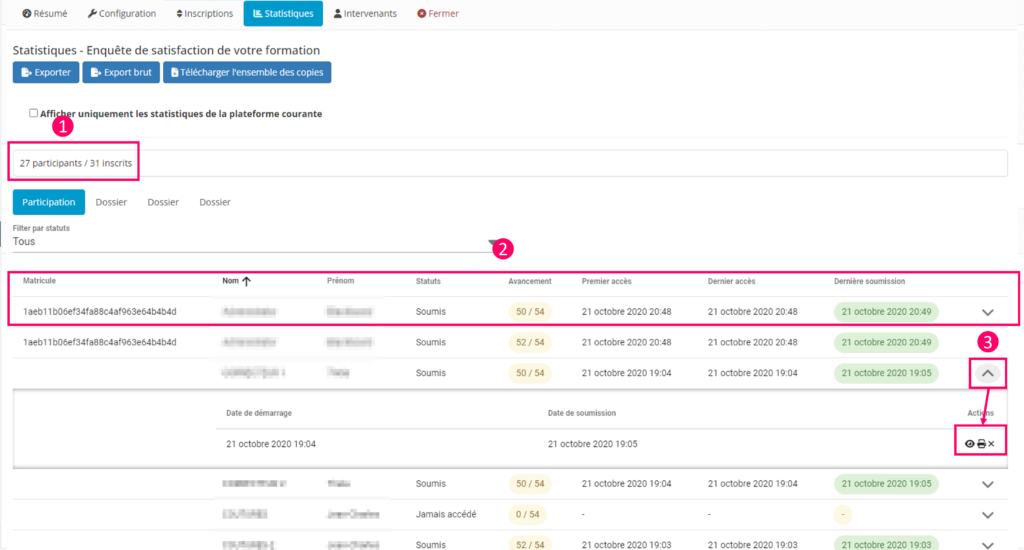
- 1: Number of participants out of the number subscribed.
- 2: Participant progress columns showing: questionnaire status, question progress, access date and submission date.
- 3: Button for viewing an individual copy. You can also delete data from the questionnaire.
3.2 Using analysis tools: filtering, cross-referencing, graphical view, etc.
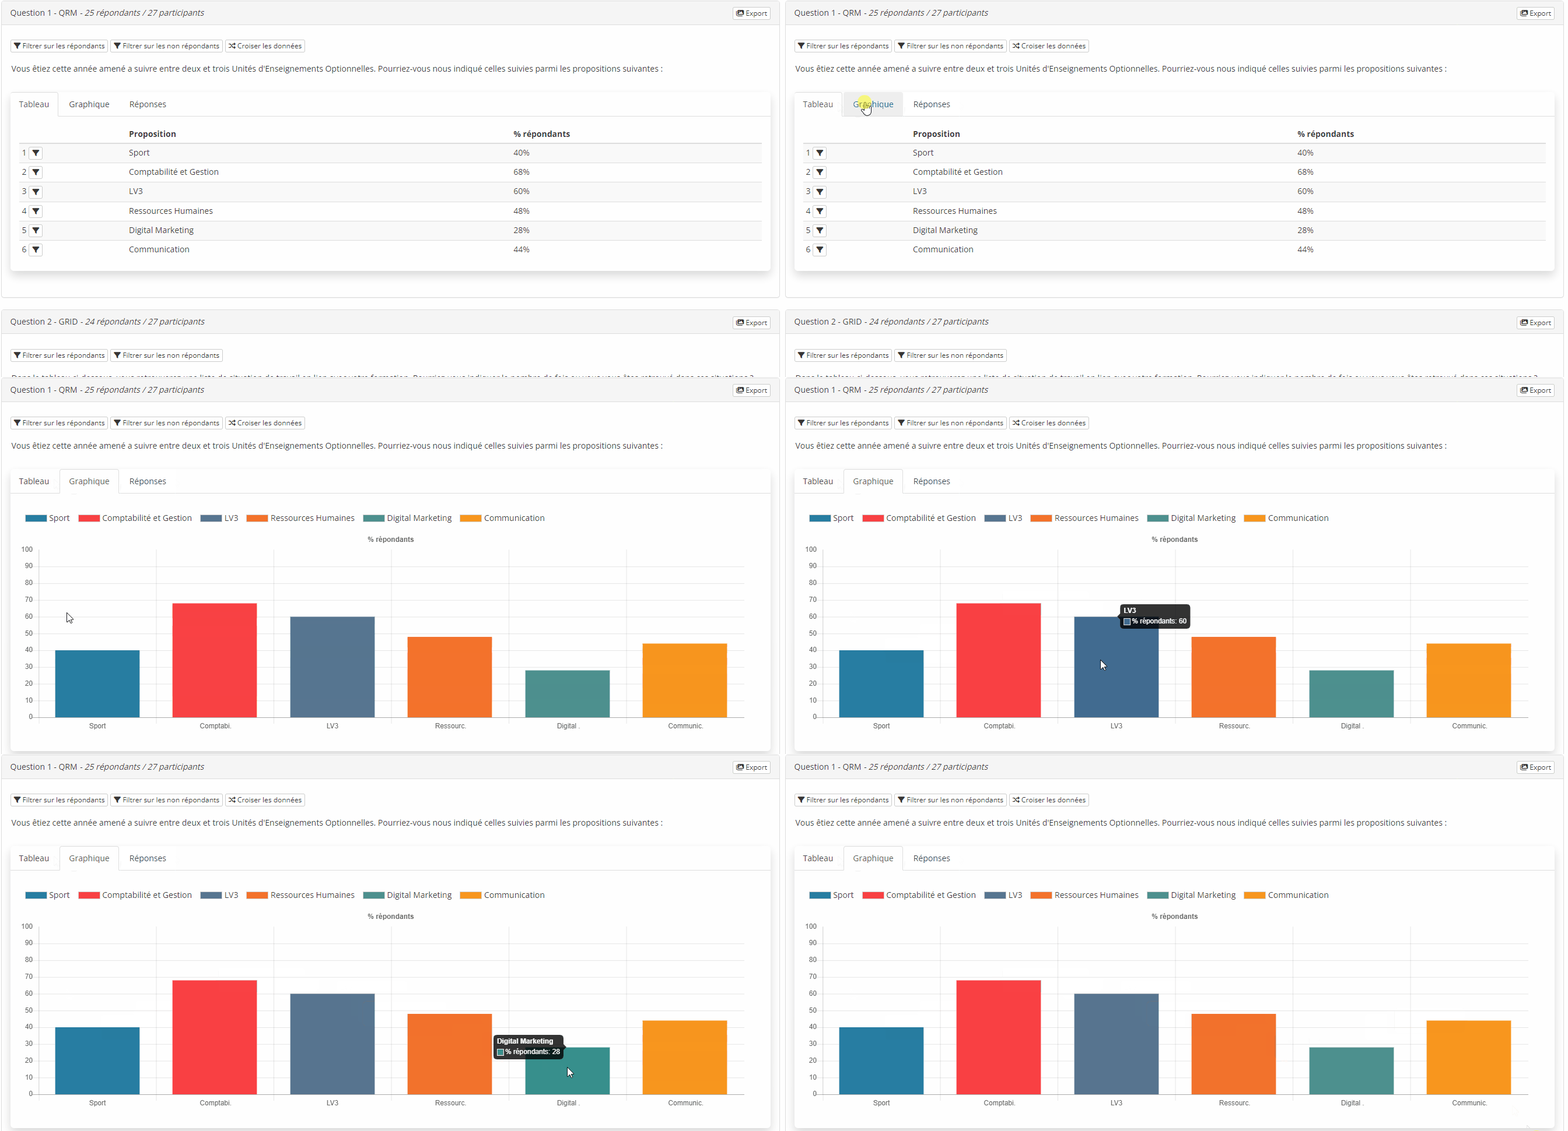
There are various tools for processing the data displayed in the results on the statistics tab of a survey session. The supervisor can apply filters to the data, mobilise a data cross-tabulation tool or display the results in graphical format.
These processing and display options are applied differently depending on the type of questions in the poll. For example, the graphical view of a single-response question is completely different from that of a Taxonomy question, or that of a multiple-response question.
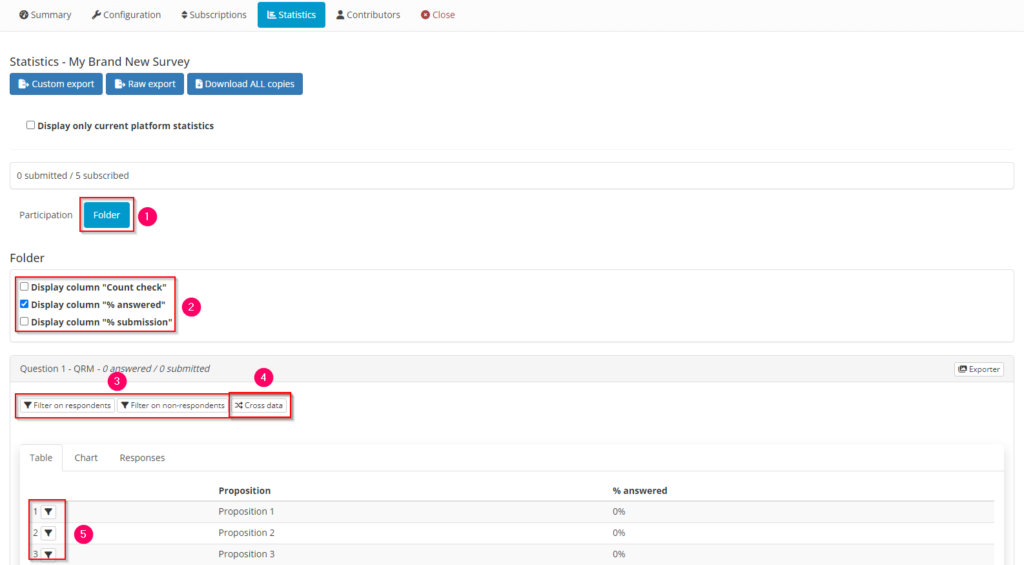
- 1: Click on the folder name to access the survey statistics
- 2: It is possible to display the number of ticks and/or the % response of respondents and/or the % response of participants
- 3: Filter on respondents or non-respondents: the results of other questions are indexed to respondents or non-respondents to the filtered question.
- 4: Data cross-tabulation tool: allows you to cross-tabulate the data between the responses to this question and all the responses to the other questions in the survey. The page is updated automatically and new tables are displayed. E.g.: I want to know in detail the answers to all my questions according to the distribution of the respondents.
- 5: Filter on a response: the results of the other questions are indexed to the respondents to the filtered proposal. The page is updated automatically on click. E.g.: I only want to display all the results for respondents who ticked the “Sport” answer to my question.
3.3 Exporting results
It is therefore possible to retrieve all the results of a survey in Excel format for manual data processing (for example, to construct graphs or reprocess the raw data from survey responses). Two Excel export formats are available: a simple export format showing the results in table format and a raw export showing all the answers given by each respondent to each question.
A copy export button is also available on this page. It can be used to create a zip archive containing the questionnaires completed by the various learners. Finally, there is an individual export option for the completed questionnaire for a given respondent.
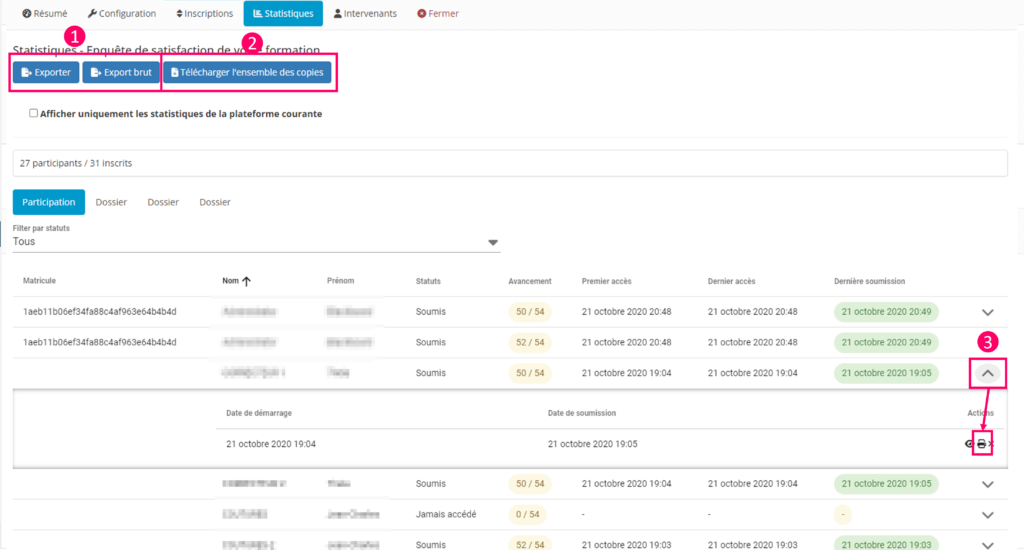
- 1: Button for simple export and raw export of data in Excel format.
- 2: Button for downloading questionnaires from all respondents.
- 3: Button for exporting the respondent’s questionnaire.
It is also possible to extract data from the tables and graphs displayed and processed (filtered data, cross-tabulated data) directly on the platform.
Each table or graph can be extracted individually and generated in image format (jpeg). Options are also available for selecting the most relevant information to be displayed in the generated image: title, question statement, distribution, etc.
Finally, the browser’s print options (CTRL+P on Windows or ⌘+P on Safari) can be used to save all the results on the page in PDF format.
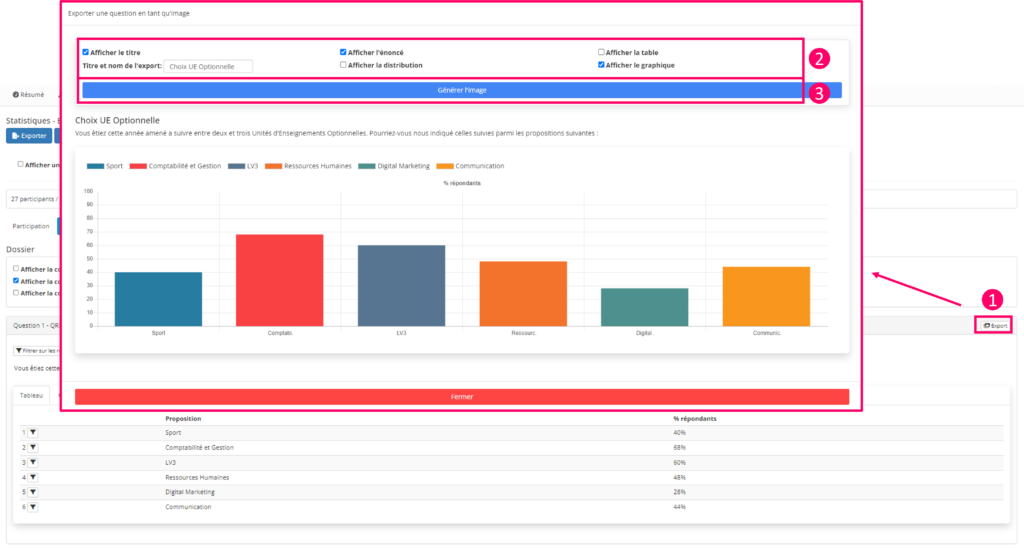
- 1: Button for exporting question results (table, graph)
- 2: Options for determining the elements to be displayed in the image
- 3: Button for generating the image in jpg format.
If you want to find out more, have a look at the tutorial below: “Creating a survey”.


